

Win/Loss Ratios vs. Profitability in Options
Win rate alone misleads options traders—profitability depends on reward-to-risk, profit factor, and expectancy.
When trading options, many focus on win rate - the percentage of trades you win. But a high win rate doesn’t guarantee profitability. Here’s why:
- Win rate tells you how often you win, but not the size of your wins or losses.
- Profitability depends on balancing win rate with risk-reward ratios (R:R) across strategies like covered calls vs. cash-secured puts.
For example, a 70% win rate might lose money if losses outweigh gains. Conversely, a 40% win rate can be highly profitable with larger wins relative to losses. Metrics like profit factor (gross profits ÷ gross losses) and expectancy (the average profit per trade) matter far more than win rate alone.
Key Takeaways:
- High win rate + poor R:R = small or negative profits.
- Low win rate + strong R:R = better profitability.
- Use tools like profit factor (≥1.5) and expectancy to measure success.
The bottom line: Don’t chase frequent wins; focus on strategies that deliver meaningful profits.
What Win/Loss Ratios Mean in Options Trading
Building on the basics, let’s break down how win/loss ratios work and why they matter in measuring trading success.
The win/loss ratio compares the number of winning trades to losing ones. For instance, if you have 12 winning trades and 18 losing trades, your win/loss ratio would be 0.67. A ratio above 1.0 means you’ve had more winners than losers.
It’s important to understand that this ratio differs from the win rate. While the win rate measures the percentage of profitable trades, the win/loss ratio focuses on the number of winners versus losers. Both metrics highlight how often you succeed, but neither reflects the magnitude of your gains or losses. This distinction is crucial for grasping their role in options trading.
How to Calculate Win Rate
The formula for win rate is straightforward: (Winning Trades ÷ Total Trades) × 100. For example, if you make 30 trades and 12 are profitable, your win rate is 40%.
In options trading, strategies like credit spreads or strangles often achieve win rates of 70% to 85%. On the other hand, trend-following strategies tend to operate with lower win rates, typically between 30% and 45%.
Why Win Rate Alone Can Be Misleading
While win rate gives a quick overview of how often you succeed, it doesn’t tell the whole story. Without factoring in the size of wins and losses, a high win rate can still result in a losing strategy.
For example, a 70% win rate might seem impressive, but if your average loss is six to eight times larger than your average win, you’ll end up in the red. Imagine a strategy with a 65% win rate where the average win is $70, but the average loss is $160. Despite winning most of the time, this strategy would lose money overall.
"A high win rate (again, winning trades/total trades) doesn't necessarily mean a trader will be successful or even profitable if the risk-reward ratio is very high." - Investopedia
Premium sellers often encounter this pitfall. Consider a strategy with a 90% win rate but a risk-reward setup where you risk $9 to make $1. In this case, a single loss wipes out the profit from nine winning trades. This demonstrates why looking at win rate alone can be dangerously misleading - it’s the context of risk and reward that ultimately determines profitability.
sbb-itb-a9ac3c2
Profitability Metrics That Matter More Than Win Rate
Win rate can be a tempting metric to focus on, but it doesn’t tell the whole story. While it shows how often you succeed, it doesn’t reveal if your trading is actually profitable. To get a clearer picture, you need to look at metrics that combine win frequency with the size of your trade outcomes.
Profit/Loss Ratio and Risk-Reward Ratio (R:R)
The profit/loss ratio, often called the R-multiple, measures the average size of your wins compared to your losses. It’s calculated as: average win ÷ average loss. For most directional traders, a ratio above 1.5 is considered a strong benchmark. This means that, on average, your winning trades are at least 1.5 times larger than your losing ones.
The risk-reward ratio (R:R) is another crucial tool, but it’s used before entering a trade. It compares the distance between your entry point and stop loss with the distance between your entry point and target. A ratio below 1.5:1 often makes a trade unjustifiable unless it comes with a high probability of success. For instance, if you’re risking $100 on a trade, your potential profit should be at least $150 to maintain a solid R:R.
"A 40% win rate can be more profitable than 70%. Stop obsessing over how often you win and start measuring what actually matters." - TradeLens
Another key metric is the profit factor, which combines both gross profit and gross loss into a single figure: Gross Profit ÷ Gross Loss. A profit factor below 1.0 means you’re losing money, regardless of how often you win. Interestingly, many professional trend-following strategies maintain win rates below 50% yet achieve strong profitability with profit factors ranging between 2.0 and 4.0.
Expectancy
Expectancy goes a step further by quantifying whether your strategy can deliver consistent profits over time. The formula is simple but powerful:
(Win Rate × Average Win) - (Loss Rate × Average Loss).
This metric shifts focus away from frequent wins and instead highlights the expected dollar value of each trade. A positive expectancy is essential for long-term success. A negative expectancy, on the other hand, guarantees losses over time, no matter how many trades you make.
For context, most profitable retail traders achieve an expectancy between $0.10 and $0.35 for every dollar risked. Professionals typically range from $0.20 to $0.50. Anything above $0.50 is rare and may indicate either a small sample size or temporary market conditions.
To ensure your expectancy calculations are reliable, analyze a sample of at least 30–50 trades, though 100 or more is ideal. Smaller samples can lead to misleading results that don’t accurately reflect your strategy’s true performance.
How Win Rate and Profitability Work Together: The Math
Win rate and reward-to-risk ratios are closely linked, forming the backbone of any profitable trading strategy. Grasping this connection can help you assess whether your approach has the potential to generate consistent returns.
Calculating Breakeven Win Rate
The breakeven win rate tells you the minimum percentage of trades you need to win to avoid losses. The formula is straightforward: 1 ÷ (1 + R), where R represents your reward-to-risk ratio (average win divided by average loss).
For example, with a 2:1 reward-to-risk ratio (your average win is twice your average loss), the breakeven win rate is 1 ÷ (1 + 2) = 33.33%. In this case, winning just over one-third of your trades would make your strategy profitable. Fall below that, and losses will pile up.
"A setup targeting three times your risk only needs to win a quarter of the time to break even, while a one-to-one idea needs to win half the time." – P&L Ledger
The relationship is inverse: as your potential reward grows relative to your risk, the win rate required to break even drops. For instance, a 1:1 ratio requires a 50% win rate, while a 5:1 ratio only needs about 16.67%. This explains why certain trend-following strategies, which aim for large wins, can succeed even with win rates below 40%.
It’s important to account for trading costs - like commissions, fees, and slippage - which increase the breakeven win rate. To include these expenses, use the adjusted formula: p = (L + c) ÷ (W + L), where p is the required win rate, L is the average loss, W is the average win, and c represents per-trade costs.
Breakeven Win Rates for Different R:R Values
The table below highlights how reward-to-risk ratios impact breakeven thresholds and shows outcomes for 60% and 40% win rates in various scenarios:
| R:R Ratio | Breakeven Win Rate | Example with 60% Win Rate | Example with 40% Win Rate |
|---|---|---|---|
| 0.5:1 | 66.67% | Unprofitable | Unprofitable |
| 1:1 | 50.00% | Profitable | Unprofitable |
| 1.5:1 | 40.00% | Profitable | Breakeven |
| 2:1 | 33.33% | Profitable | Profitable |
| 3:1 | 25.00% | Profitable | Profitable |
| 5:1 | 16.67% | Profitable | Profitable |
Notice how a 40% win rate needs at least a 1.5:1 reward-to-risk ratio to break even. Meanwhile, even a strong 60% win rate results in losses if the ratio is as low as 0.5:1.
This math underscores why a strategy with a 62% win rate but a reward-to-risk ratio of 0.48:1 can yield a negative expectancy of -$12.40 per trade. On the flip side, a 40% win rate paired with a 2.5:1 ratio can deliver more than double the profitability of a 65% win rate with a 0.8:1 ratio.
Before initiating any options trade, take a moment to estimate realistic target and stop levels to calculate your reward-to-risk ratio. Then, compare your historical win rate for similar setups to the breakeven threshold, ensuring there’s a comfortable margin. Lastly, track your actual average wins and losses in a trading journal rather than relying solely on theoretical outcomes from payoff diagrams. This approach helps you evaluate the performance of your strategies in real-world conditions.
Options Trading Examples: Win Rate vs. Profitability
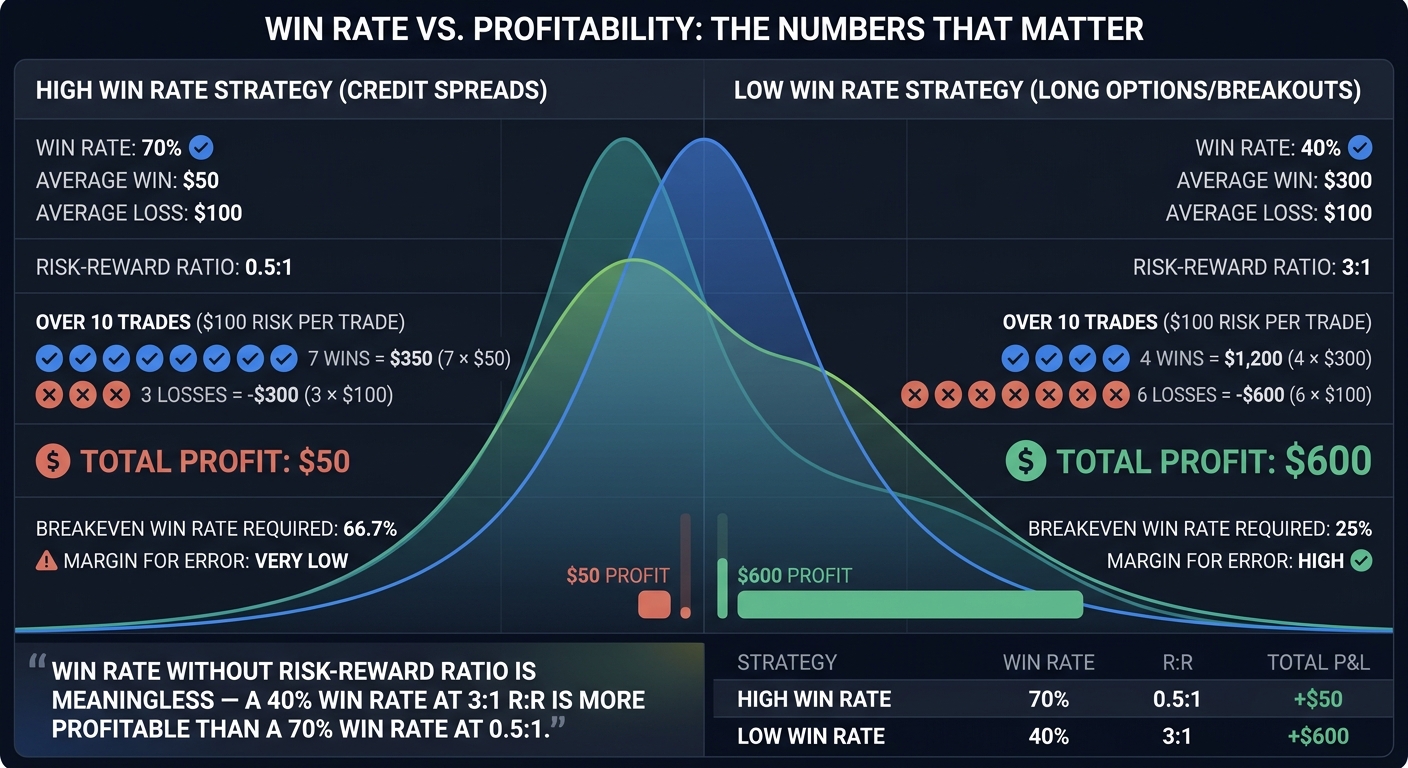
Win Rate vs Profitability Comparison in Options Trading
Let's dive into how win rate and profitability interact in real trading scenarios. These examples show why chasing a high win rate can sometimes hurt your bottom line, while a lower win rate paired with smart risk management often leads to better results.
High Win Rate, Low R:R Example
Imagine a trader using a credit spread strategy with a 70% win rate. At first glance, that win rate sounds impressive. But let's look closer: the average win is $50, and the average loss is $100, giving a risk-reward ratio of 0.5:1.
Over 10 trades, with $100 at risk per trade, this trader wins seven times, earning $350 ($50 × 7), and loses three times, losing $300 ($100 × 3). Total profit: $50, or a 5% return on $1,000 in total risk.
The problem? This strategy needs at least a 66.7% win rate just to break even, leaving almost no room for error. James Mitchell from StratBase.ai explains the common pitfall:
"Humans crave high win rates because losing feels bad... They set wide stops and tight targets. This produces a high win rate with terrible risk-reward - the exact combination that bleeds accounts slowly."
This example shows that even a high win rate can fail if the risk-reward ratio is poor.
Low Win Rate, High R:R Example
Now, consider a directional options trader focused on breakouts. This trader has a 40% win rate but aims for a higher payoff: their average win is $300, while the average loss is $100, resulting in a 3:1 risk-reward ratio.
Over the same 10 trades, risking $100 per trade, this trader wins four times, earning $1,200 ($300 × 4), and loses six times, losing $600 ($100 × 6). Total profit: $600 - 12 times more than the high-win-rate example.
This strategy only requires a 25% win rate to break even, providing a much larger margin for error. Gary M. from Trader's Second Brain sums it up perfectly:
"Win rate without risk-reward ratio is meaningless - a 40% win rate at 3:1 R:R is more profitable than a 70% win rate at 0.5:1."
Side-by-Side Strategy Comparison
Here's how the numbers stack up over 10 trades with $100 risk per trade:
| Strategy Type | Win Rate | Avg Winner | Avg Loser | R:R Ratio | Total P&L |
|---|---|---|---|---|---|
| High Win Rate (Credit Spreads) | 70% | $50 | $100 | 0.5:1 | +$50 |
| Low Win Rate (Long Options) | 40% | $300 | $100 | 3:1 | +$600 |
The trader with the lower win rate ends up earning significantly more because their larger wins offset more frequent losses. These examples highlight how balancing win rate with risk-reward is essential for building a profitable strategy. It's not just about winning often - it's about winning smart.
How to Balance Win Rate and Profitability
The examples above highlight an essential truth: a high win rate doesn’t guarantee success. To achieve long-term results, you need a strategy that balances win rate with strong risk-reward principles.
Setting Minimum Profit/Loss Ratios
Establishing a clear profit/loss ratio is critical. For directional options trades, aim for at least a 2:1 reward-to-risk ratio. This means your average winning trade should be at least twice the size of your average losing trade. With this approach, you can stay profitable even with a win rate as low as 35–40%, creating some breathing room during inevitable losing streaks.
This ratio also helps you avoid the "win rate trap", where traders prioritize boosting their win percentage by setting tight profit targets and wide stop losses. As StratBase.ai explains:
"Win rate is the most deceptive metric in trading. A 75% win rate sounds impressive until you learn that the average winner is $200 and the average loser is $800."
Beyond this, ensure your strategy meets acceptable profit factor benchmarks to maintain overall profitability.
Once you’ve defined these trade-level standards, it’s essential to evaluate their impact on your entire portfolio.
Tracking Performance Across Your Portfolio
While analyzing individual trades is helpful, portfolio-level metrics provide a broader and more accurate view of your trading performance. This involves monitoring key factors like total Greeks exposure, maximum drawdown (which should ideally stay under 15–25% of your account), and the effect of fees on your returns.
High trading fees can significantly reduce profits. If your commissions exceed 20% of your gross profit, it’s a red flag that your strategy may not be sustainable. This is particularly relevant for multi-leg strategies like iron condors, where costs can add up quickly.
Platforms like ThetaEdge simplify portfolio analysis by automatically tracking metrics across all holdings. Instead of manually calculating profit factors or Greeks from broker statements, these tools provide a clear view of which strategies are driving growth and which are draining resources. This kind of insight helps you stay disciplined and resist the urge to cut winners short just to maintain a high win rate.
Conclusion
A high win rate might feel comforting, but it doesn’t guarantee profitability. As options trader Brayden Ward puts it:
"POP indicates how frequently you're correct, while EV shows if those wins are profitable."
This contrast becomes clear when you examine different trading scenarios. For example, a 70% win rate can still lead to losses if your average losses outweigh your wins significantly. On the other hand, a trader with just a 40% win rate can achieve 2.4 times higher profits when backed by a strong risk-reward ratio.
Win rate measures how often you win, but profitability metrics determine the value of those wins. Traders who succeed focus on metrics like profit factor (≥1.5) and expectancy to balance the frequency of wins with their magnitude.
Grasping these metrics helps differentiate between temporary losing streaks and deeper strategy issues. It also prevents the mistake of chasing high win rates at the expense of meaningful returns. This is especially critical in high-probability strategies like credit spreads, where a single loss can erase months of progress. By tracking both win rate and profitability - through tools like expected value and profit factor - you shift your focus from simply being right to ensuring your wins are meaningful enough to outweigh losses. Combining these metrics creates a strategy that not only wins often but also wins effectively.
For self-directed investors, platforms like ThetaEdge (https://thetaedge.ai) offer portfolio-aware tools that seamlessly incorporate these metrics into your trading approach.
FAQs
What win rate do I need to break even?
To break even in options trading, your win rate needs to align with the inverse of your risk-reward ratio. For instance, if your potential reward is three times the amount you're risking, your minimum win rate to break even would be around 25%.
What’s the difference between win rate and expectancy?
Win rate tells you how often your trades succeed, expressed as a percentage. While it's useful, it doesn’t reveal the whole picture - specifically, it ignores the size of your wins and losses. That’s where expectancy comes in. Expectancy measures the average profit or loss per trade, taking into account not just your win rate but also the magnitude of your gains and losses. This makes it a more complete measure of a strategy’s overall profitability compared to win rate alone.
How can I accurately track my average wins and losses?
Keeping a detailed trading log is a game-changer for monitoring your progress and refining your strategy. Record every trade's entry and exit dates, position size, prices, fees, and net profit or loss. Go a step further by categorizing each trade as either a winner or a loser, leaving out breakeven trades (usually about 3–5%).
To make the most of this data, review your log quarterly or annually. This helps you calculate the average size of wins and losses, giving you a clearer picture of your performance. By regularly updating and analyzing your log, you'll stay on top of your trading habits and make more informed decisions moving forward.