

How Liquidity Affects Covered Call Expiration Dates
How option liquidity, open interest and bid-ask spreads determine the best covered-call expirations and why 30–45 DTE monthlies often offer the best balance.
When comparing covered calls vs cash-secured puts or simply selling calls, liquidity directly impacts your costs, returns, and trading flexibility. It determines how easily you can trade options without losing money to slippage or wide bid-ask spreads. Here’s what matters most:
- Short-term options (1–30 days) generally have higher liquidity, tighter spreads, and faster time decay, making them ideal for frequent trading.
- Monthly expirations (standard third Friday) offer the best balance of liquidity and pricing, making them the go-to choice for most covered call strategies.
- Long-term options (LEAPS) often have lower liquidity, slower time decay, and wider spreads, which can limit flexibility.
To choose the right expiration date, focus on high open interest, tight bid-ask spreads, and standard monthly options for better efficiency and lower costs. Always use limit orders to avoid paying more in less liquid markets.
How Liquidity Affects Expiration Date Selection
When choosing an expiration date, liquidity plays a significant role in shaping your trading experience. Standard monthly options, which expire on the third Friday of each month, generally offer the highest liquidity. This makes it easier to execute trades and adjust positions when needed. Liquidity directly impacts both the price you get when entering or exiting trades and your ability to make timely adjustments later.
Short-Term vs. Long-Term Expiration Dates
The choice between short-term options (1–4 weeks) and long-term options (45+ days) comes with trade-offs in liquidity and pricing. Options in the 30–45 day range often hit the sweet spot, offering high liquidity and a faster rate of time decay (theta), which benefits sellers. Many traders aim for the 20–50 day window to balance these factors effectively.
Weekly options, while attractive for their rapid theta decay, often have wider bid-ask spreads compared to standard monthly options. These wider spreads can lead to higher slippage, meaning the price you expect may differ from the price you actually get. On the other hand, LEAPS (long-term options expiring in 1–2 years) offer larger upfront premiums but decay more slowly and may suffer from inconsistent liquidity. Some LEAPS contracts even see zero daily trading volume.
Here's a quick comparison of different timeframes:
| Expiration Type | Typical Liquidity | Theta Decay | Best Suited For |
|---|---|---|---|
| Weekly (1–7 days) | Moderate to Low | Rapid | Active traders who manage positions frequently |
| Monthly (30–45 days) | High | Accelerating | Most covered call sellers seeking a balance |
| LEAPS (1–2 years) | Variable | Gradual | Long-term strategies with higher upfront premiums |
This breakdown highlights why traders often prioritize tighter spreads and higher liquidity when managing positions.
The Role of Tighter Spreads and Higher Open Interest
Tighter bid-ask spreads and higher open interest are crucial for minimizing trading costs and slippage. A good rule of thumb is to aim for spreads that are 10% or less of the ask price. For instance, a $0.05 spread on a $0.95 ask meets this standard, while a $0.40 spread on a $2.00 ask does not.
High open interest ensures there are enough participants in the market, making it easier to enter or exit trades without significantly affecting the option's price. This becomes especially important when rolling positions - closing an existing call and opening a new one with a different expiration date. Illiquid options can make rolling more expensive due to wider spreads.
Standard monthly expirations, with their higher liquidity, simplify both position adjustments and rolling strategies. This makes them an excellent choice for covered call setups. For newer traders or those who prefer less active management, sticking to these monthly options can help avoid the challenges of higher slippage and intensive monitoring often associated with weekly options.
How to Identify Liquid Expiration Dates for Covered Calls
Choosing expiration dates with strong liquidity doesn’t have to be a guessing game when using an options strategy planner. By focusing on specific metrics within the option chain, you can zero in on dates that offer fair pricing and smoother trade execution.
Scanning the Option Chain for Liquidity
Start by reviewing open interest and daily trading volume for each expiration date. Look for options with open interest above 1,000 contracts and daily volume exceeding 100 contracts. These thresholds suggest an active market, which helps keep bid-ask spreads tight. On the other hand, options with open interest below 100 often have wider spreads, which can eat into your profits.
Next, evaluate the bid-ask spread as a percentage of the mid-price. Ideally, the spread should stay under 10% of the mid-price. For example, if an option’s bid is $1.00 and the ask is $1.10, the mid-price is $1.05, and the spread is about 9.5%, which is reasonable. But a $1.00 bid with a $1.30 ask results in a spread of roughly 26%, signaling high transaction costs.
Finally, check the bid and ask sizes to ensure the market can handle larger trades. For highly liquid securities like SPY or QQQ, spreads can be as tight as $0.01, indicating excellent liquidity.
By focusing on these metrics, you can quickly identify expiration dates that are liquid enough for efficient trading.
Prioritizing Standard Monthly Expirations
Once you’ve assessed liquidity metrics, give preference to standard monthly options, which expire on the third Friday of each month. These dates typically attract the most trading activity from both institutional and retail investors, leading to tighter spreads and deeper markets compared to weekly or quarterly expirations. Most trading volume is concentrated in front-month contracts expiring within 30 days, making standard monthlies a dependable choice.
If a stock doesn’t offer weekly options, it may indicate limited market interest, which can also mean lower liquidity for its monthly options. On the flip side, stocks with daily trading volumes over 1 million shares are more likely to have liquid options markets suitable for short-term trades. To avoid paying too much in less liquid environments, always use limit orders set at the mid-point between the bid and ask.
Comparing Liquidity Across Expiration Timeframes
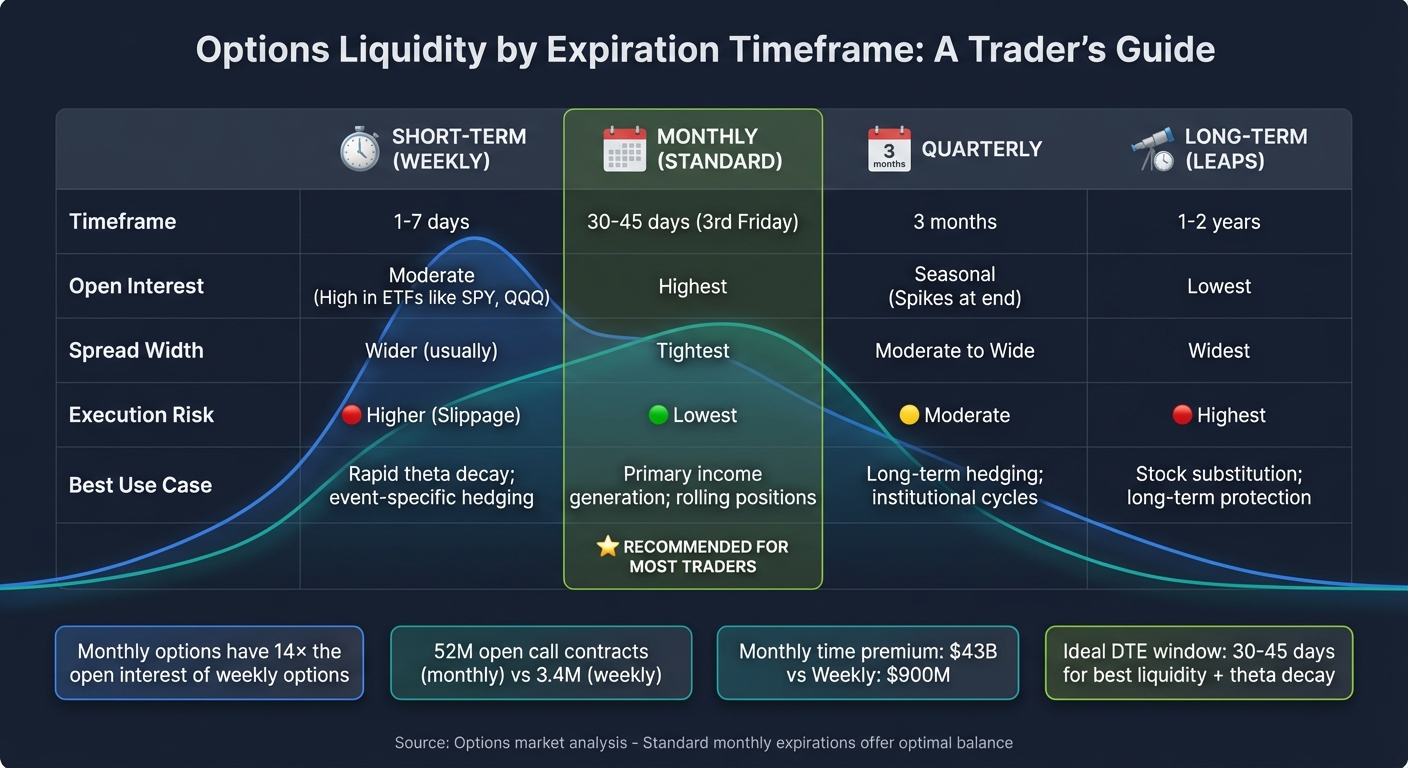
Covered Call Options Liquidity Comparison by Expiration Timeframe
Let's take a closer look at how liquidity varies across different expiration timeframes and why it matters when executing trades or setting up your covered call strategy. The differences in market activity across these timeframes can significantly impact pricing and execution quality.
Short-Term vs. Monthly vs. Quarterly Expirations
Monthly expirations dominate the options market, offering higher open interest and tighter spreads. These contracts, which expire on the third Friday of each month, are the go-to choice for most traders. To put this into perspective, monthly options typically have about 14 times the open interest of weekly options. For example, in one snapshot, January monthly expirations held 52 million open call contracts, compared to just 3.4 million for all January weekly expirations combined. The time premium on monthly options also far outweighs that of weeklies, reaching roughly $43 billion compared to $900 million for weeklies.
"The vast majority of weeklys have significantly wider spreads and lower liquidity than the average monthly option."
– Mike Scanlin, Founder, Born To Sell
Weekly options, while offering faster theta decay, come with trade-offs like wider spreads and higher slippage. These issues are less pronounced for high-volume symbols such as SPY, AAPL, or QQQ, where weekly liquidity can rival that of monthly options. However, for most other securities, the cost of trading weeklies can outweigh the benefits of their rapid time decay.
Quarterly options, on the other hand, present a different liquidity pattern.
Quarterly options see a surge in trading volume only in the week of expiration. Unlike monthly contracts, which maintain steady activity throughout their lifecycle, quarterly expirations experience significant spikes in volume just before they expire. Outside these periods, they can be challenging to trade at fair prices, making them less ideal for strategies like covered calls that may require frequent adjustments or early exits.
Quick Reference: Expiration Timeframe Liquidity Characteristics
| Expiration Timeframe | Open Interest | Spread Width | Execution Risk | Best Use Case |
|---|---|---|---|---|
| Short-Term (Weekly) | Moderate (High in ETFs) | Wider (usually) | Higher (Slippage) | Rapid theta decay; event-specific hedging |
| Monthly (Standard) | Highest | Tightest | Lowest | Primary income generation; rolling positions |
| Quarterly | Seasonal (Spikes at end) | Moderate to Wide | Moderate | Long-term hedging; institutional cycles |
| Long-Term (LEAPs) | Lowest | Widest | Highest | Stock substitution; long-term protection |
For covered call strategies, monthly options strike the best balance between liquidity, cost efficiency, and time decay. They offer predictable trading conditions and are the top choice for investors aiming to generate consistent income while minimizing execution risks.
sbb-itb-a9ac3c2
Using ThetaEdge to Assess Liquidity and Optimize Expirations
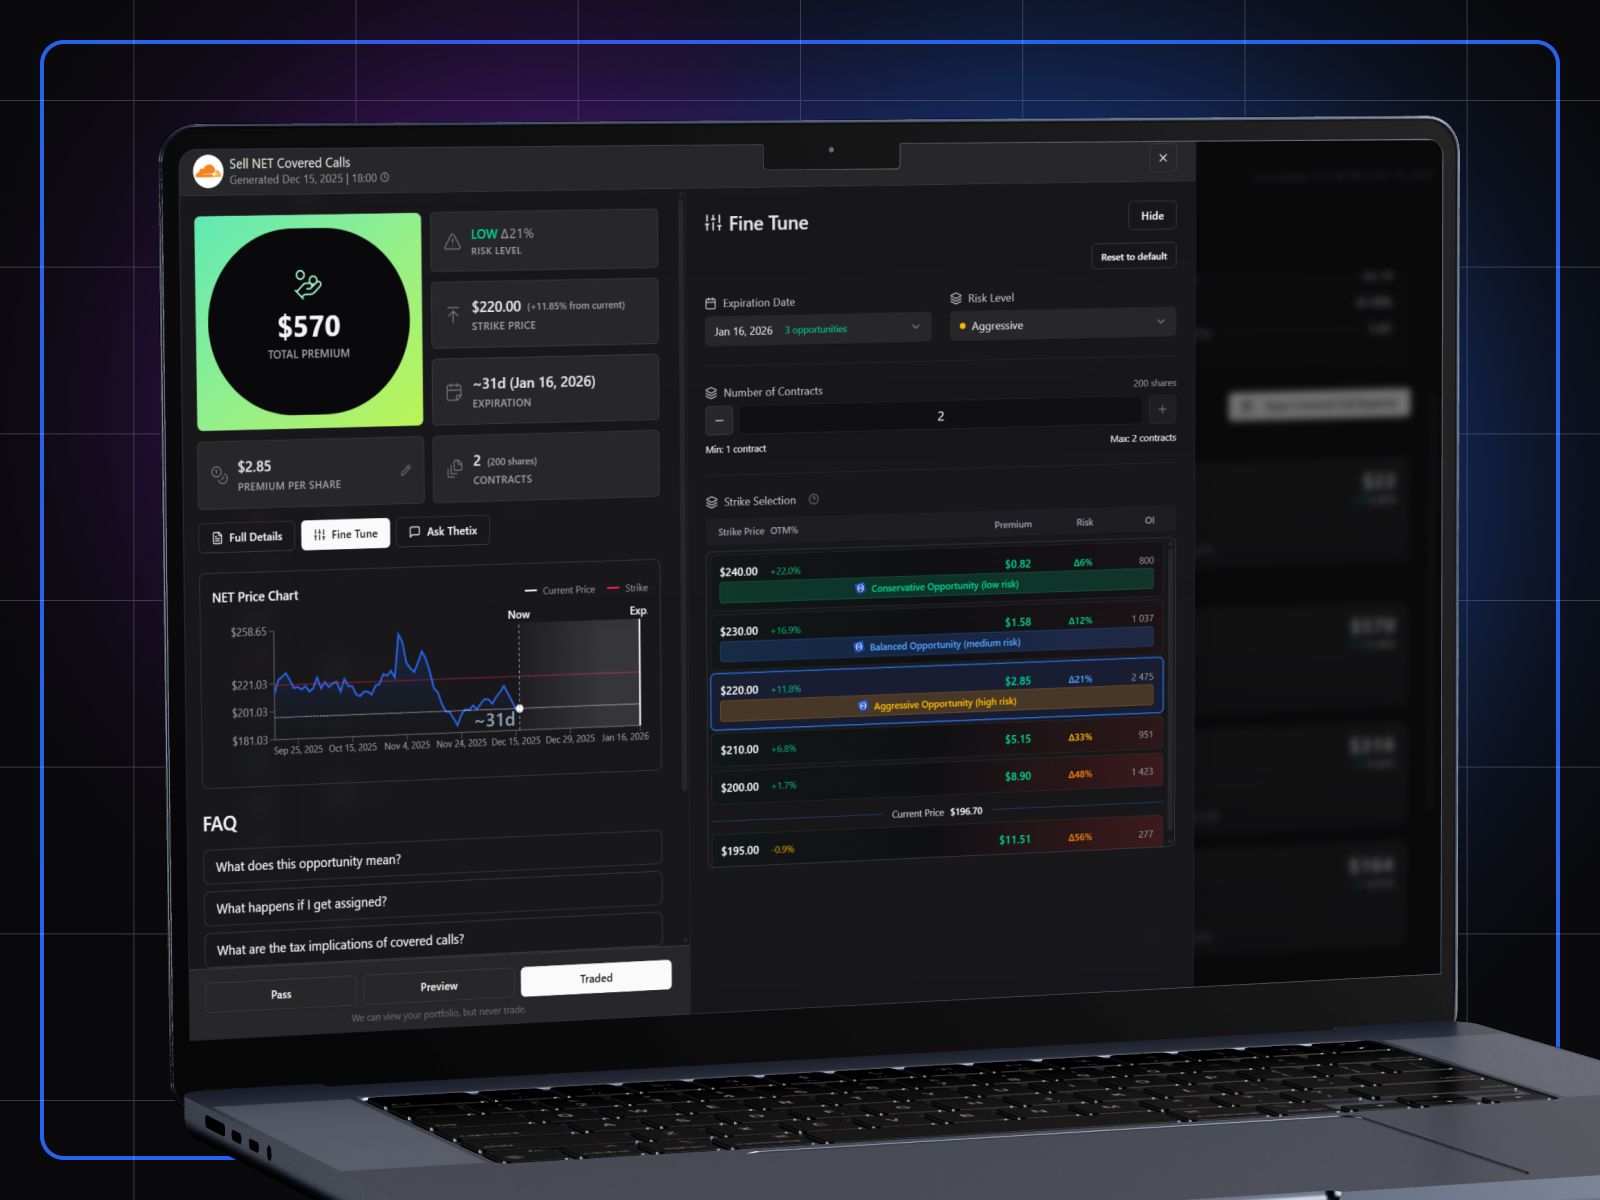
ThetaEdge takes the guesswork out of identifying liquid options by automating the process with highly detailed analytics. It streamlines the selection of expiration dates, eliminating the need to manually sift through option chains. By analyzing thousands of scenarios, ThetaEdge uncovers covered-call opportunities tailored to your portfolio. It delivers precise insights on strike prices, expiration dates, and assignment probabilities, making it easier to align decisions with your investment strategy.
AI-Driven Insights for Liquidity Analysis
The Strategy Analyzer is a powerful tool for visualizing how premiums and returns on investment shift across different Days to Expiration (DTE) ranges. This feature helps pinpoint the optimal time frame for capturing theta. Instead of relying on guesswork to balance premium income with execution quality, you can track how liquidity metrics evolve over time. Key phases, such as the 30–45 DTE window or the final week before expiration, are highlighted by AI-driven analysis. Additionally, the platform calculates portfolio Greeks, giving you a clearer picture of your overall exposure.
Thetix, an intuitive AI assistant, simplifies liquidity analysis by allowing you to ask questions in plain English. For instance, you could ask, “Which expiration dates have the tightest spreads for my Apple shares?” and receive immediate, data-backed answers - no need to wade through complex spreadsheets or charts.
"I developed institutional tools to analyze thousands of scenarios in real time, set alerts, and manage complex strategies with precision timing... ThetaEdge empowers [self-directed investors] to do it with the same tools the elite have always used." – Maxim Khailo, Founder & CEO, ThetaEdge
Tailored Covered-Call Opportunities
ThetaEdge goes beyond analysis, turning insights into actionable trade recommendations. By connecting with more than 80 brokerages, it offers a unified view of your positions and provides liquidity analysis customized to your portfolio - completely eliminating the hassle of manual data entry.
Each day, AI-generated reports spotlight the best opportunities and flag expiring positions. These reports include specific trade suggestions designed to maximize portfolio income. As expiration dates approach, ThetaEdge offers detailed roll strategies with credit and debit analysis, ensuring you maintain exposure in highly liquid contracts.
Automated alerts at critical decision points, such as the 21-day mark - where you’ve typically captured 60–70% of the maximum profit - help you make timely decisions. These alerts also guide you through the potential liquidity issues that often arise in the final days before expiration, keeping your strategy on track.
Key Takeaways on Liquidity and Expiration Dates
Here’s what stands out when it comes to liquidity and expiration dates:
- Liquidity impacts your costs. Wider bid-ask spreads can eat into your premium through slippage. On the other hand, highly liquid options like SPY or QQQ often have spreads as tight as $0.01, keeping costs low.
- Standard monthly expirations offer the best liquidity. Options expiring on the third Friday of each month attract the most volume and have the tightest spreads. For covered call strategies, the 30-to-45-day window is ideal, balancing strong liquidity with faster theta decay.
- Open interest signals market depth. Look for options with open interest in the hundreds or thousands. High open interest ensures tighter spreads and makes it easier to adjust or close your position without significantly impacting the market.
- Limit orders help in low-liquidity scenarios. Placing limit orders at the bid-ask midpoint can reduce hidden costs and let you retain more of the premium in less liquid markets.
These points highlight how liquidity plays a key role in selecting expiration dates for covered calls, ensuring efficiency and better returns.
FAQs
What makes an expiration date “liquid” for covered calls?
When an expiration date is described as "liquid" for covered calls, it means there's high trading activity associated with it. This includes robust volume (the number of contracts traded) and open interest (the number of outstanding contracts). Liquidity matters because it leads to tighter bid-ask spreads, making it easier to enter and exit positions at fair prices. In short, sufficient liquidity helps keep trading efficient while reducing costs.
When should I choose weekly vs. monthly expirations?
When deciding between weekly expirations and monthly expirations, it all comes down to your strategy and goals.
Weekly options, expiring every Friday, are perfect for short-term strategies. They offer faster time decay, meaning you can collect premium more quickly. Plus, they provide frequent opportunities to adjust your positions based on market movements.
On the other hand, monthly options are better suited for longer-term strategies. These expire on the third Friday of each month and come with higher premiums. With slower time decay, they give your market outlook more time to play out, making them a strong choice if you're looking for a bit more breathing room.
How do I avoid slippage in less liquid options?
To reduce slippage in less liquid options, focus on contracts with higher liquidity. Pay attention to options that show higher trading volume, tight bid-ask spreads, and greater open interest. Avoid low-volume or low open-interest options, as they often come with wider spreads and make exiting positions more challenging. Opting for near-the-money strikes with short to medium expiration dates can also help improve liquidity and limit slippage.