

Strike Price Selection: Risk vs Reward Analysis
Balance premium income against assignment risk and capped upside — use delta and downside cushion to choose ITM, ATM, or OTM covered-call strikes.
When you sell a covered call, the strike price you choose determines your income, risk, and the likelihood of losing your shares. Here's the trade-off: higher premiums mean more income upfront but also a higher chance of assignment, capping your stock's upside. Lower premiums reduce assignment risk but offer less income.
Key Points:
- In-the-Money (ITM): High premiums, high assignment risk, best for income-focused strategies.
- At-the-Money (ATM): Balanced premiums and assignment risk, ideal for neutral markets.
- Out-of-the-Money (OTM): Lower premiums, lower assignment risk, allows room for stock growth.
Metrics to Consider:
- Delta: Indicates assignment probability (e.g., 0.30 Delta = 30% chance).
- Downside Cushion: Measures how much the stock can drop before incurring a loss.
Example:
For a stock at $100:
- ITM ($95): High premium ($7), higher assignment risk (65%+).
- ATM ($100): Moderate premium ($4), balanced risk (50%).
- OTM ($105): Low premium ($2), low risk (<30%).
Takeaway:
Choose a strike price based on your goals - whether maximizing income, protecting against losses, or leaving room for growth. Tools like ThetaEdge can simplify the decision by analyzing key metrics like Delta and downside cushion.
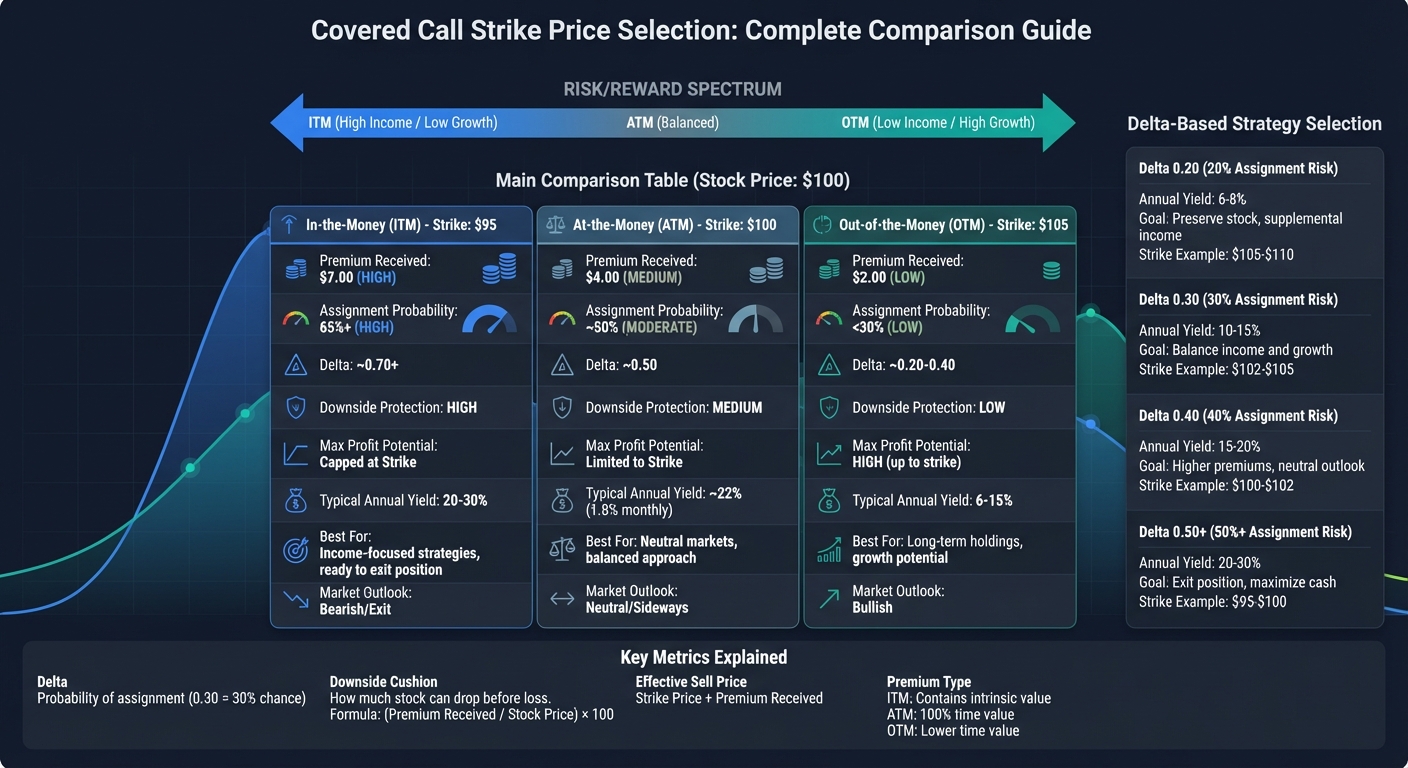
Covered Call Strike Price Comparison: ITM vs ATM vs OTM Risk-Reward Analysis
In-the-Money (ITM) Strike Prices: Higher Premiums, Limited Stock Gains
An in-the-money (ITM) covered call involves selling a call option with a strike price set below the current market value of the stock. This conservative approach provides higher upfront premiums and offers some protection against declines in the stock price.
The main draw here is the larger premium. Since ITM options include intrinsic value, they deliver more income upfront compared to other strike price choices. This can lower your break-even point and cushion potential losses if the stock price drops.
However, the trade-off is clear: your potential gains are capped. If the stock climbs above your strike price, you miss out on profits beyond that level. Moreover, the likelihood of assignment is high - often exceeding 65% - which means your shares are more likely to be called away. This strategy works best for those prioritizing immediate income over the possibility of substantial stock gains.
John Clarke of StrikePrice.app sums it up well:
"The core trade-off with an in-the-money covered call is simple: you sacrifice the potential for large gains in exchange for a higher probability of profit and greater downside protection."
Let’s take a closer look at the specific risks and rewards associated with ITM strikes.
Risk and Reward Tradeoffs for ITM Strikes
ITM strikes are particularly useful if you’ve already decided to sell a stock at a set price. They allow you to lock in that sale price while collecting additional premium income. Under favorable conditions, aggressive ITM strategies have historically delivered annual returns of 20–30%.
That said, this strategy isn’t ideal for stocks you intend to hold long-term. The high likelihood of assignment means you’ll likely lose your shares, which could disrupt your long-term investment goals. Additionally, assignment can trigger capital gains taxes and reset your holding period, potentially converting long-term gains into short-term ones. These tax implications should be carefully considered.
The risk of early assignment is particularly high with dividend-paying stocks, especially just before the ex-dividend date. To avoid this, it’s essential to review dividend and earnings dates before selling ITM calls.
This balance of higher income and limited upside is clearly illustrated in the comparison table below.
Comparison Table: ITM vs. Stock Price Outcomes
Here’s how ITM calls compare to other strike price strategies when the stock is trading at $100:
| Call Type | Strike Price | Premium Received | Downside Protection | Max Profit Potential | Assignment Probability |
|---|---|---|---|---|---|
| In-the-Money (ITM) | $95 | High ($7.00) | High | Capped at Strike | High (65%+) |
| At-the-Money (ATM) | $100 | Medium ($4.00) | Medium | Limited to Strike | Moderate (~50%) |
| Out-of-the-Money (OTM) | $105 | Low ($2.00) | Low | High | Low (<30%) |
For instance, an ITM call on AAPL in November 2025 generated a total profit of $2,300, even though the shares were called away. This demonstrates how the premium can help offset the limited upside.
One important guideline: never sell a strike price below your adjusted cost basis (your purchase price minus any previous premiums) unless you’re intentionally ready to realize a loss.
sbb-itb-a9ac3c2
At-the-Money (ATM) Strike Prices: Middle Ground Between Income and Assignment
Choosing an at-the-money (ATM) covered call involves selling options at a strike price close to the stock's current value. This approach offers a balanced trade-off: moderate premium income and about a 50% chance of assignment if the stock remains steady. It’s a strategy that sits in the middle ground, providing a mix of benefits and limitations worth considering.
One of the key advantages of ATM strikes is their high time premium. Since these options have no intrinsic value, their entire worth comes from extrinsic value, which decays quickly as expiration nears. This makes them particularly effective for capturing theta decay in a market that isn’t trending strongly in either direction. Gavin, Founder of OptionsTradingIQ, underscores this point:
"At-the-money options have the most time premium of any option strike".
However, there’s a trade-off. While the premium collected can boost income, it also limits your upside if the shares are called away. Historical data from the CBOE S&P 500 BuyWrite Index, which tracks ATM covered call performance, shows an average monthly premium of 1.8% - equivalent to about 22% annually. But this comes at the expense of missing out on market rallies.
Another consideration is the high Gamma risk associated with ATM options. Small price movements near expiration can cause significant shifts in delta, increasing the likelihood of assignment. A backtest of zero-day-to-expiration (0DTE) ATM covered calls on the SPX from 2018 to 2026 revealed annualized returns of just 6.8%. Frequent assignments often caused traders to miss overnight gains, which dampened overall performance.
ATM strikes work best when you’re comfortable selling shares at their current price and want to prioritize immediate income. However, they’re less suitable if you expect the stock to climb significantly or intend to hold onto your shares for the long term.
Risk and Reward Tradeoffs for ATM Strikes
The ATM strategy shines when you’re ready to part with your shares at current levels. Selling an ATM call allows you to collect extra premium while waiting for assignment. With a delta of approximately 0.50, the likelihood of assignment hovers around 50%.
The downside protection is moderate. While the premium provides a cushion against small declines, it won’t shield you from larger losses. For instance, in February 2026, AMD was trading at $155. Selling a 30-day ATM $155 call brought in a $5 premium with a 50% chance of assignment. In contrast, an out-of-the-money (OTM) $160 strike offered a $3 premium with about a 30% probability of assignment, while an in-the-money (ITM) $150 strike yielded a higher assignment likelihood of roughly 65%.
To manage risk, aim to close or roll ATM calls once you’ve achieved 50% of the premium. This reduces the risk of assignment as expiration nears. Also, always check your adjusted cost basis - selling an ATM call below your purchase price minus prior premiums could result in a realized loss if assigned.
Avoid using ATM strikes before earnings announcements or other significant events, as their high Gamma sensitivity increases the risk of unexpected assignment. A helpful tool is the ATR Reality Check (14-day ATR × 1.5–2), which can help you gauge whether normal price swings might trigger assignment.
These considerations highlight the balance ATM strikes offer: they generate income while maintaining controlled assignment risk, making them a practical choice for neutral market conditions.
Key Metrics for ATM Strikes
Here’s a breakdown comparing ATM strikes to other options strategies when the stock is trading at $100:
| Metric | At-the-Money (ATM) | Out-of-the-Money (OTM) | In-the-Money (ITM) |
|---|---|---|---|
| Delta | ~0.50 | ~0.20–0.40 | ~0.70+ |
| Assignment Probability | ~50% | 15–30% | >50% |
| Premium Type | 100% Time Value | Lower Time Value | Contains Intrinsic Value |
| Market Outlook | Neutral/Sideways | Bullish | Bearish/Exit |
| Upside Potential | None (Capped at Strike) | Partial (Up to Strike) | None |
| Downside Protection | Moderate | Low | High |
ATM strikes excel at generating income through time decay but limit your ability to profit from stock price appreciation. They are best suited for sideways markets where the primary goal is to earn premium rather than capitalize on price movements.
Out-of-the-Money (OTM) Strike Prices: Stock Growth Potential with Smaller Premiums
OTM covered calls are a go-to choice for investors with a bullish outlook, as they allow for stock growth while still collecting some income. Here's how it works: you set the strike price above the stock's current value, which means smaller premiums upfront but the chance to benefit from price appreciation up to the strike price.
The trade-off is simple: less immediate income for the possibility of higher returns if the stock rises. This mix of premium income and potential capital gains can make OTM strikes appealing in rising markets. Consider this example:
Back in June 2012, an investor held Netflix at $75.00 and sold an OTM $80.00 call for a $2.60 premium. This move generated a one-month return of 3.5%. If Netflix hit $80.00, the investor would also gain 6.7% in capital appreciation, bringing the total return to 10.2%.
Lower Assignment Risk with OTM Strikes
OTM strikes tend to carry a reduced risk of assignment compared to ITM or ATM options. For instance, a 0.30 delta strike (roughly 2–5% above the current price) has about a 30% chance of assignment, while a 0.20 delta strike (5–10% OTM) lowers that probability to around 20%. This makes OTM strikes particularly appealing for investors focused on long-term growth or those who want to keep collecting dividends.
Studies back this up. A 2006 Goldman Sachs analysis found that selling 2% OTM calls on the S&P 500 outperformed both buy-and-hold strategies and ATM options. More recently, a backtest of zero-day-to-expiration SPX covered calls (2018–2024) revealed that a 1% OTM approach delivered annualized returns of 14.2%, outpacing the 12.4% return from buy-and-hold and the 6.8% from ATM strategies.
Downsides and Ideal Scenarios for OTM Strikes
While OTM strikes offer growth potential, they come with smaller premiums, which provide limited downside protection. Additionally, their low delta can make adjustments costly if the market moves against you. These strikes work best in bullish, low-volatility markets. However, they should be avoided before earnings announcements, as unexpected price swings could lead to unwanted assignments.
Risk and Reward Tradeoffs for OTM Strikes
OTM strikes strike a balance between generating income and preserving long-term ownership. Many traders gravitate toward a 0.30 delta strike, which offers about a 30% assignment probability and annual yields of 10–15%. For a more cautious strategy, a 0.20 delta strike - with a 20% assignment chance and yields in the 6–8% range - may be better suited.
Take this example from February 2026: AMD was trading at $155.00, and a trader sold a 30-day $160.00 call (0.30 delta) for a $3.50 premium, or $350 total. This trade offered approximately a 70% chance of retaining shares. If assigned at $160.00, the trader's total profit would be $1,350 - $1,000 in capital gains plus the $350 premium.
For stocks with high volatility, such as NVDA or TSLA, it’s often wise to choose wider OTM strikes (targeting a 0.20–0.25 delta) to reduce the likelihood of the strike being breached. If the stock price surges past your strike, rolling to a higher strike with a later expiration can help manage the position.
Comparison Table: OTM Strikes by Distance from Market Price
Here’s a quick comparison of OTM strike options for a stock priced at $100:
| Strike Type | Strike Price | Delta | Assignment Prob. | Typical Annual Yield | Best For |
|---|---|---|---|---|---|
| Conservative OTM | $105–$110 | 0.20 | ~20% | 6–8% | Long-term holdings you want to keep |
| Balanced OTM | Balanced OTM | $102–$105 | 0.30 | ~30% | 10–15% |
| Aggressive OTM | $100–$102 | 0.40 | ~40% | 15–20% | Neutral to slightly bearish outlook |
OTM strikes provide a way to benefit from stock price appreciation while still earning premium income. However, the smaller premiums mean they don't offer as much downside protection as ATM or ITM strategies.
Key Metrics for Strike Price Selection: Delta and Downside Cushion
Once you've identified ITM, ATM, and OTM strikes, the next step is to evaluate them using two important metrics: Delta and downside cushion. Delta helps gauge the likelihood of assignment, while the downside cushion measures how much the stock can drop before you start losing money.
Using Delta for Assignment Probability
Delta isn't just about tracking how an option's price changes with the stock - it’s also a tool for estimating the probability of assignment. For instance, a Delta of 0.30 suggests a 30% chance of assignment, while a 0.50 Delta (ATM) indicates about a 50% chance.
"Delta is more than just a Greek letter - it's a probability engine that helps you choose the right strike price based on your goals using an options strategy planner."
- Ben T., Investment Strategist, OraniaTech
If your primary goal is income generation, aiming for strikes with a Delta around 0.40 can balance solid premiums with moderate assignment risk. On the other hand, if keeping your stock is your priority, you might lean toward strikes with a Delta closer to 0.05 or 0.10 to minimize the chance of assignment. Many traders also prefer options with 30–45 days to expiration, as this timeframe offers a good mix of time decay and manageable assignment probabilities.
It’s worth noting that Delta’s reliability can fluctuate based on implied volatility (IV). When IV is above the 70th percentile, Delta may overestimate assignment risk, while lower IV (below the 30th percentile) may cause it to underestimate the risk. Additionally, the probability of a stock touching the strike price before expiration is roughly double the Delta.
| Delta Target | Assignment Probability | Primary Goal |
|---|---|---|
| 0.20 Delta | ~20% | Preserve stock; earn supplemental income |
| 0.30 Delta | ~30% | Balance income and growth potential |
| 0.40 Delta | ~40% | Collect higher premiums; neutral to bearish outlook |
| 0.50+ Delta | 50%+ | Exit position; maximize upfront cash |
With Delta providing insight into assignment risk, the next step is to calculate your downside protection.
Calculating Effective Sell Price and Downside Cushion
To fully assess your strike price choice, you’ll need to determine your effective sell price and downside cushion. The effective sell price combines your strike price with the premium collected. For example, selling a $160 call for $3.50 gives you an effective sell price of $163.50 if assigned - that’s the total amount you’d receive.
The downside cushion, on the other hand, shows how much the stock can fall before you start incurring losses. Here’s how it’s calculated:
- Breakeven Price = Current Stock Price − Total Premium Received
- Downside Cushion (%) = (Total Premium Received / Current Stock Price) × 100
For example, if a stock is trading at $50.10 and you sell an ITM call at $46.00 for a $5.10 premium, your breakeven price would be $45.00, providing an 8.2% downside cushion. Alternatively, selling an OTM call with a $29.00 strike on a $28.00 stock for $0.51 offers a smaller 1.75% downside cushion but allows for more upside if the stock rises.
Typically, ITM strikes provide the most downside protection since their premiums include both intrinsic and extrinsic value. ATM strikes focus on maximizing time value but offer less cushion, while OTM strikes provide minimal protection, favoring potential gains if the stock appreciates.
A helpful tip: use the 14-day Average True Range (ATR) multiplied by 1.5 to 2.0 as a benchmark to ensure your selected strike is realistic. Adding this value to the stock price can help determine whether your strike lies within the range of typical price movement, making it more likely to be tested regardless of Delta.
ThetaEdge Tools for Strike Price Analysis
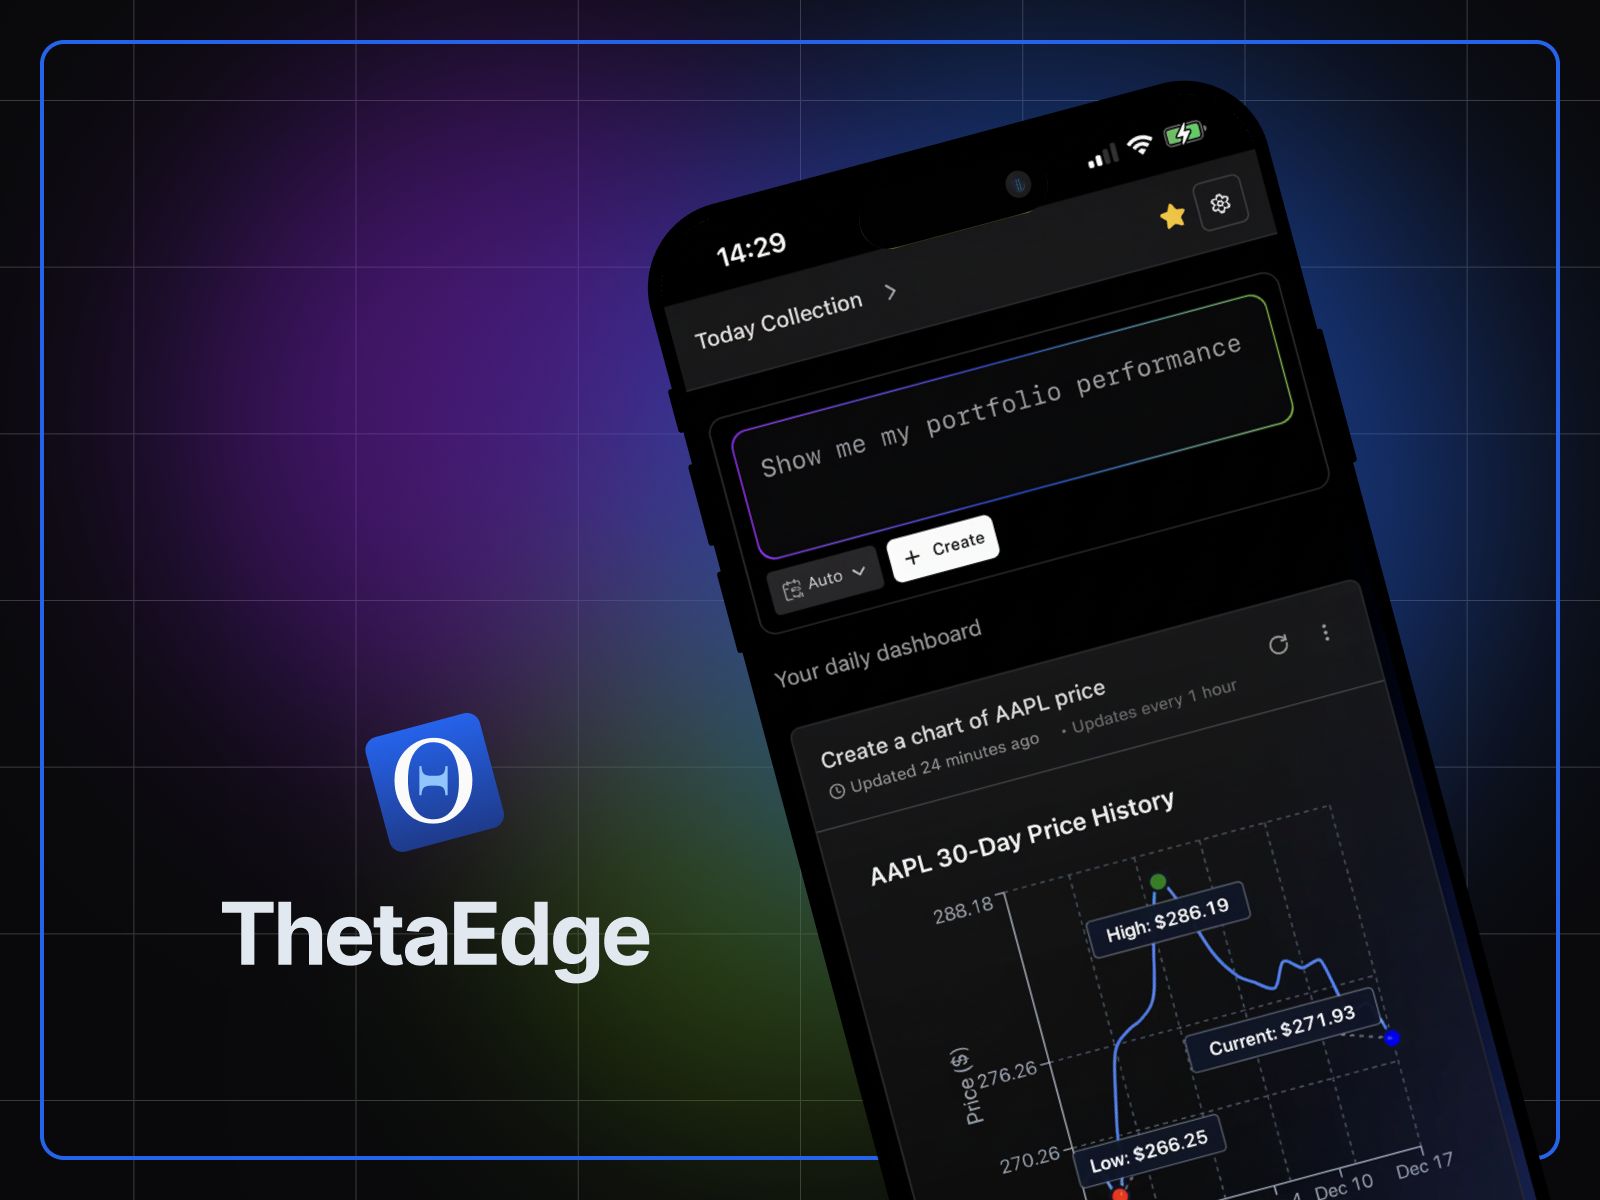
Choosing the right strike price involves weighing factors like Delta, downside cushion, and the probability of assignment. ThetaEdge simplifies this process by identifying covered-call opportunities tailored to your portfolio’s needs.
The platform combines professional-grade analysis with a user-friendly interface, offering a clear view of risk profiles, profit potential, and assignment probabilities. Instead of manually crunching numbers or comparing multiple strike prices across expirations, you can quickly assess how each option aligns with your financial goals - whether that’s generating income or focusing on growth.
Portfolio-Specific Strike Recommendations with Risk Metrics
ThetaEdge takes it a step further by offering recommendations that reflect your portfolio’s unique makeup. It tracks key market Greeks across your holdings, helping you understand how individual covered calls impact your overall exposure. This holistic view ensures that every decision fits seamlessly into your broader strategy.
The platform’s Thetix AI assistant is another standout feature. It provides plain-language answers to your trading questions and actionable insights. Whether you’re wondering, “What are my top income opportunities this week?” or “How would a 5% market drop affect my portfolio?” Thetix delivers immediate, data-backed responses tailored to your positions.
"Maxim Khailo, Founder & CEO of ThetaEdge, states that the platform's real-time scenario analysis empowers self-directed investors with institutional-grade tools".
For positions that need adjustment, ThetaEdge offers detailed roll strategies - whether you’re rolling up, down, or out. It breaks down each scenario, showing exactly how much capital is involved and the potential outcomes. This feature makes it easier to adapt when trades don’t go as planned, giving you a clear path forward.
Conclusion
Choosing the right strike price is a balancing act between generating income and allowing room for stock appreciation. In-the-money (ITM) strikes provide the highest premiums but significantly cap your upside. At-the-money (ATM) strikes offer the best extrinsic value and a moderate (~50%) chance of assignment. Meanwhile, out-of-the-money (OTM) strikes let you benefit from potential stock growth but come with smaller premiums. The trade-offs here are largely guided by metrics like delta.
For many, a 30-delta strike is a practical starting point, offering about a 30% chance of assignment and annual yields in the 10–15% range. Conservative investors might lean toward 20-delta strikes, which yield around 6–8%, while more aggressive traders may opt for 40-delta strikes, aiming for 15–20% yields. Importantly, avoid selling calls below your adjusted cost basis - your purchase price minus collected premiums - to ensure you don’t lock in a loss.
"Strike selection isn't about finding the 'perfect' strike – it's about aligning your strike with your goals." – QuantWheel
Using delta as a guide simplifies decision-making. For example, a 0.30 delta reflects a 30% chance that the option will end in-the-money. In periods of high volatility, selecting further OTM strikes can help you secure similar premiums while reducing the risk of assignment. Additionally, tools that calculate the downside cushion - how far the stock can drop before you face a loss - can be especially helpful when considering ITM strikes.
Whether your priority is steady income or holding onto stock for future growth, your strike selection should align with your portfolio's goals. Platforms like ThetaEdge make this process easier by consolidating key metrics like extrinsic value, assignment probabilities, and portfolio Greeks. Instead of relying on spreadsheets or guesswork, these tools help ensure your strategy stays focused on achieving your income and growth objectives.
FAQs
How do I pick a strike if I want income but don’t want to lose my shares?
When aiming to balance generating income with keeping your shares, it's wise to select a strike price that has a lower likelihood of assignment. A popular choice is a 30-delta strike, as it typically provides a reasonable blend of premium income and lower assignment risk. Opting for out-of-the-money (OTM) strikes can also be a smart strategy, as they allow you to earn income while reducing the chances of your shares being called away. Ultimately, the choice should align with your personal risk tolerance and income objectives.
What delta range fits my outlook (bullish, neutral, bearish)?
For a neutral outlook, choosing a delta between 0.30 and 0.50 offers a middle ground - providing decent premium income while reducing the likelihood of the option ending in-the-money at expiration. If your perspective leans bullish, a lower delta (around 0.20–0.30) might be more suitable, as it reflects optimism about the stock's potential to rise. On the other hand, a higher delta (above 0.50) typically signals a more bearish or cautious stance, prioritizing income over upside potential.
How do I calculate my breakeven and downside cushion before selling a call?
To figure out your breakeven, take the price you paid for the stock and subtract the premium you earned from selling the call. For instance, if you purchased the stock at $100 and collected a $3 premium from the call, your breakeven point lands at $97.
Your downside cushion is the premium you received, which helps absorb potential losses. In this example, the $3 premium means you wouldn’t start losing money until the stock falls below $97.