

How to Assess Liquidity Before Trading Options
Evaluate options liquidity with the VOSS checklist—volume, open interest, spread, and size—to minimize slippage and improve trade execution.
When trading options, liquidity is key to ensuring smooth transactions and minimizing costs. Liquidity impacts bid-ask spreads, slippage, and execution risks. Here's what you should focus on:
- Bid-Ask Spread: Narrow spreads (e.g., $2.00 x $2.03) mean lower costs. Wide spreads (e.g., $2.20 x $3.00) increase break-even thresholds.
- Trading Volume: High daily volume (hundreds or thousands of contracts) ensures active markets and better execution.
- Open Interest: Higher open interest (thousands of contracts) reflects market depth and ease of exiting positions.
- Order Size: Check contract availability at quoted prices to avoid slippage, especially for larger trades.
For better execution, use limit orders at the mid-price and focus on liquid underlyings like SPY, QQQ, or AAPL. Tools like ThetaEdge can simplify liquidity analysis by combining metrics like volume, open interest, and spreads into a single platform.
Key Tip: Stick to options with tight spreads, high volume, and significant open interest to reduce costs and risks.
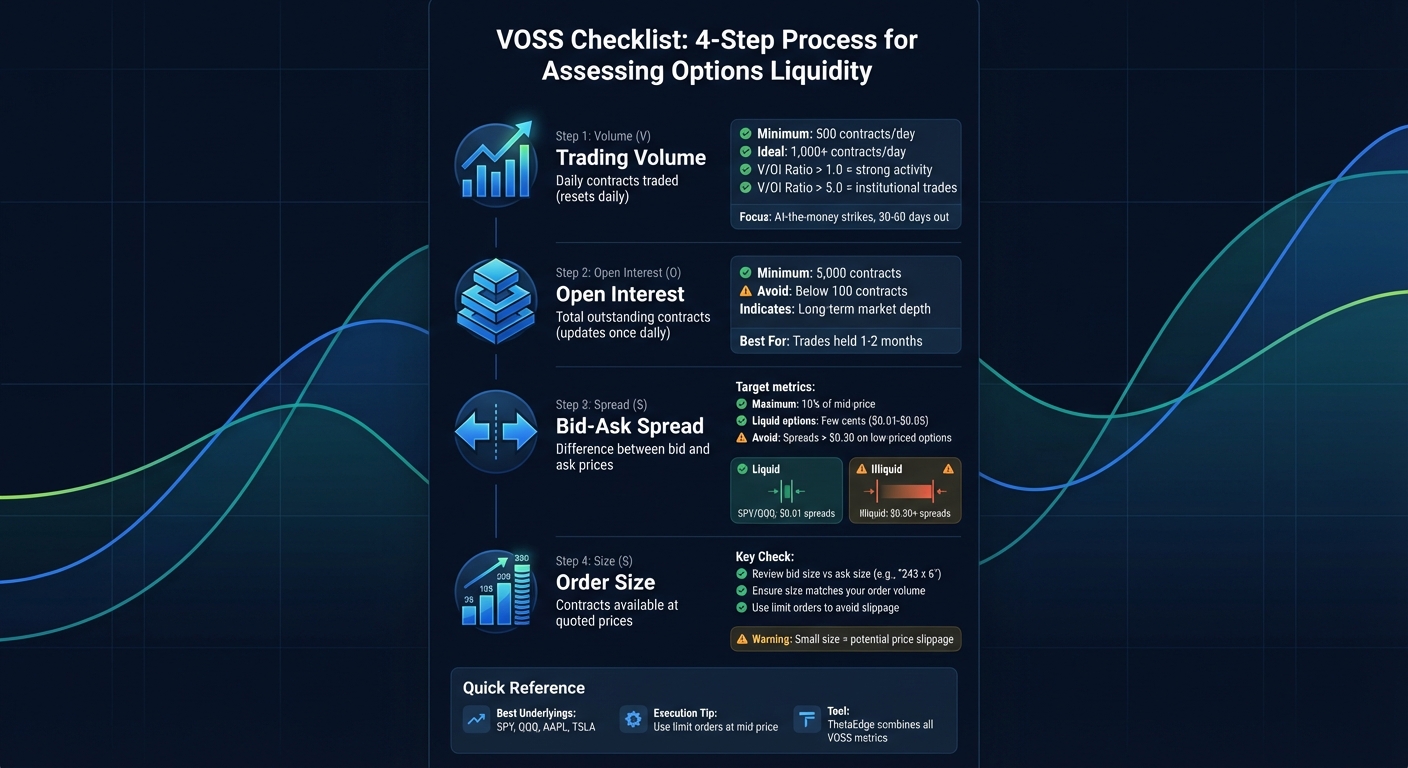
VOSS Checklist for Assessing Options Liquidity
Key Metrics for Measuring Options Liquidity
When evaluating options liquidity, three metrics stand out: trading volume, open interest, and the bid-ask spread. Each provides unique insights into market activity and depth, helping you make more informed trading decisions.
Trading Volume
Trading volume measures the number of contracts traded in a single day, resetting at the start of each session. It reflects real-time market interest and activity. Generally, higher trading volume leads to tighter bid-ask spreads and smoother trade execution. Activity is often concentrated in at-the-money strikes and front-month expirations (30–60 days out). For example, ETFs like SPY typically see most of their volume in near-term contracts.
A useful tool here is the Volume-to-Open Interest (V/OI) ratio. A ratio above 1.0 suggests strong new activity, while a ratio exceeding 5.0 - especially when prior open interest was low - can indicate institutional-level trades. For better execution, focus on strikes with daily volumes in the hundreds, ideally 1,000 or more contracts.
Next, let’s compare open interest vs. volume to get a broader view of market depth.
Open Interest
Open interest tracks the total number of outstanding contracts that remain open and unclosed. Unlike trading volume, it’s cumulative and reflects the longer-term commitment of market participants. Open interest updates once a day - usually before the market opens - and increases only when a buyer and seller create a new contract.
For strong liquidity, aim for open interest in the thousands. If open interest is below 100, you might face wider spreads and challenges exiting your position. For trades you plan to hold for one to two months, prioritizing open interest over volume ensures counterparties will likely be available when it’s time to exit.
| Metric | Volume (Daily Contracts) | Open Interest (Total Outstanding Contracts) |
|---|---|---|
| Reset Frequency | Resets daily | Updates once daily (based on prior session) |
| Market Signal | Reflects current session activity | Indicates long-term market depth |
| Liquidity Role | Affects immediate entry/exit | Supports future exit and overall structure |
With volume and open interest covered, the bid-ask spread offers a quick snapshot of current liquidity conditions.
Bid-Ask Spread
The bid-ask spread shows the difference between the highest price a buyer will pay (bid) and the lowest price a seller will accept (ask). A narrow spread signals active trading and lower transaction costs, while a wide spread indicates reduced liquidity and higher risk.
"The spread between the bid and ask of any stock or option is the default measure of market liquidity for that instrument." – Jason Ruchel, Strategy Expert, OptionsHawk
For liquid options, spreads are often just a few cents. However, illiquid options may have spreads of $0.30 or more, which can significantly impact execution. For instance, an option priced at $0.80 with a $0.30 spread makes it harder to trade efficiently.
To reduce costs, use limit orders instead of market orders. Calculating the mid-price - the average of the bid and ask - helps you secure a fair execution. For high-priced stocks like TSLA or AMZN, a $0.50 spread might be acceptable if it’s a small percentage of the option’s total price.
sbb-itb-a9ac3c2
Checking Market Depth and Order Size
Once you've assessed the immediate trade size using the bid-ask quotes, it's time to dive deeper into the order book for a more complete picture of liquidity. Beyond the bid-ask spread, it's crucial to evaluate how many contracts are available at the quoted prices. The "Size" column in your options chain provides this information, showing the number of contracts available at both the bid and ask prices. Keep in mind that in options trading, a size of "1" represents a single contract, unlike stocks where "1" typically equals 100 shares.
Bid-Ask Size
The bid size reflects how many contracts buyers are prepared to purchase at the best bid price, while the ask size shows how many contracts sellers are offering at the best ask price. For instance, if you see "243 x 6", it means there are 243 contracts bid but only 6 offered at the ask price. Such an imbalance becomes especially critical when you're trading larger volumes.
If you attempt to buy 10 contracts but only 1 is available at the quoted ask, the remaining contracts will likely fill at worse prices. A September 2025 example from TradingBlock illustrates this issue: a trader placed a market order to buy 10 call options at a quoted ask of $2.00, with the displayed size being just 1 contract. The result? The trader was filled for 1 contract at $2.00, 3 contracts at $2.30, and 6 contracts at $3.00. This led to an average fill price of $2.69 instead of the expected $2.00. To avoid such slippage, using a limit order is essential, especially when the visible size is smaller than your intended trade.
It's also worth noting that market makers often display smaller sizes than their actual trading capacity. As Dan Passarelli explains:
"The 'real market' is usually tighter and in greater size (deeper) than the disseminated quotes."
Testing the mid-price with a limit order can help you gauge the true depth of the market without exposing yourself to the full bid-ask spread.
Market Depth Beyond the Top Quotes
The order book, sometimes referred to as "Level 2" quotes, provides a view of contract volumes available at various price levels beyond the best bid and ask. This deeper insight is invaluable for determining whether the market can handle larger trades without causing significant price shifts. A robust order book with considerable volume across multiple price levels signals strong liquidity, while a sparse book suggests that larger orders could drive prices further, increasing slippage.
Analyzing the distribution of orders can also help identify potential support and resistance levels. For example, a high concentration of buy orders at a particular price might indicate strong support, while a cluster of sell orders could signal resistance. However, be mindful of spoofing - fake orders that disappear quickly and distort the perceived market depth. For traders handling larger or more intricate orders, reviewing the full order book ensures you get a clearer picture of actual liquidity, rather than relying solely on the top-of-book quotes.
Step-by-Step Process for Checking Liquidity
Filtering Options Chains
Start by focusing on high-volume underlyings to ensure tighter spreads and smoother execution. Stocks or ETFs like AAPL, TSLA, SPY, and QQQ are great examples, as they typically offer the tightest spreads and the deepest liquidity. For instance, in highly liquid products like SPY and QQQ, option spreads can be as narrow as $0.01.
Concentrate on at-the-money (ATM) strikes, as these tend to have the most volume, open interest, and the tightest spreads. For expirations, a window of 30–60 days out is ideal. This timeframe strikes a balance between active trading interest and sufficient time decay, which is particularly useful for covered call strategies. Monthly expirations, usually on the third Friday of each month, often feature higher open interest compared to weekly options.
To refine your choices, avoid contracts with daily volume below 500 or open interest below 5,000. Pay close attention to the bid-ask spread - steer clear of contracts where the spread exceeds 10% of the option's mid-price to avoid unnecessary transaction costs.
Use the VOSS checklist - Volume, Open Interest, Spread, and Size - to evaluate each trade. Verify how many contracts are realistically available at the quoted prices before proceeding.
For a more efficient process, consider using automated tools to enhance your analysis.
Using ThetaEdge for Combined Analysis
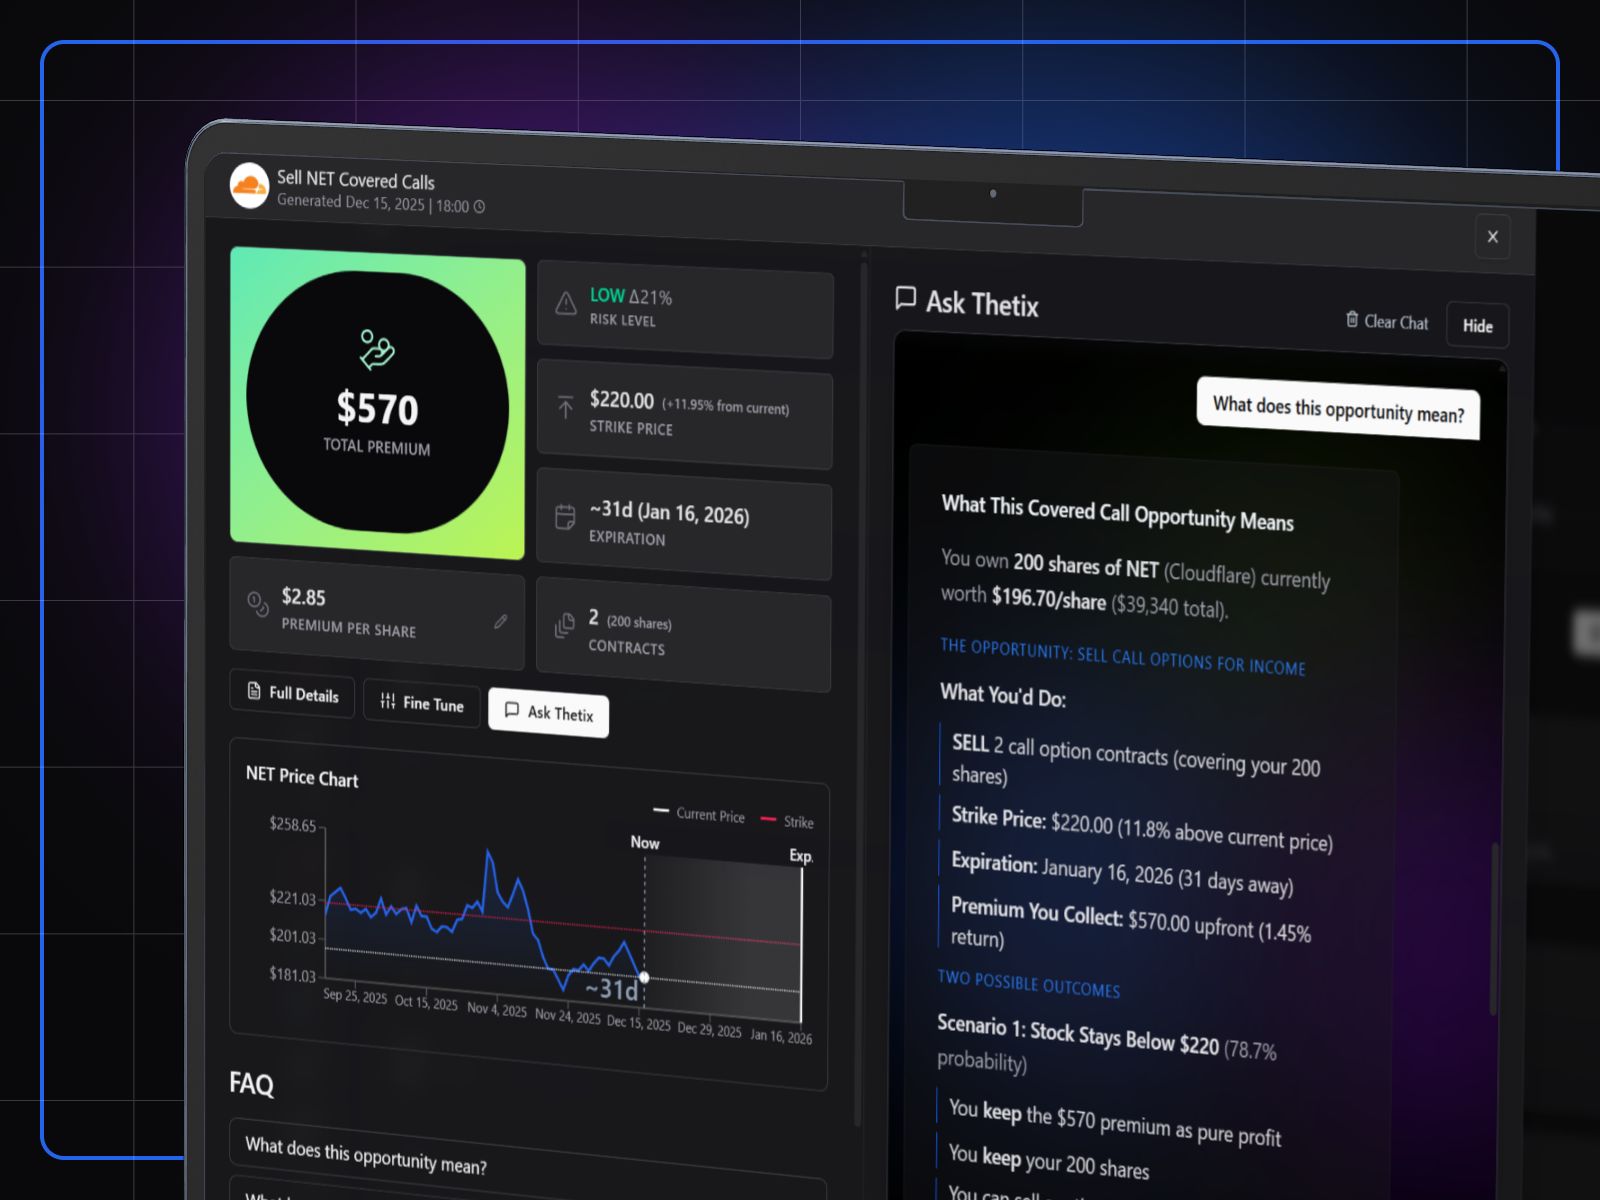
While manual filtering is effective, leveraging an integrated platform can save time and improve accuracy. ThetaEdge simplifies the liquidity evaluation process by consolidating multiple key metrics into a single, user-friendly interface designed specifically for covered-call strategies. Instead of manually reviewing volume, open interest, and spreads across different tools, the platform combines these indicators with detailed risk/reward metrics and AI-driven insights to help you identify viable options on stocks you already own.
The platform's Thetix AI assistant provides portfolio-specific insights, answering questions about liquidity conditions and helping you assess whether a particular covered call has enough market depth for your position size. This eliminates the need to switch between multiple tools or calculate ratios manually. Additionally, ThetaEdge offers daily AI-generated action plans that account for current liquidity conditions, ensuring you’re not only spotting profitable opportunities but also selecting trades that can be executed at favorable prices.
Summary: What to Remember About Liquidity Assessment
Using the VOSS checklist - Volume, Open Interest, Spread, and Size - is key to avoiding execution issues and unnecessary costs in your options trades. These metrics give you a clear picture of whether you can enter and exit a position smoothly without losing your trading edge. Volume reflects daily activity, while open interest provides insight into longer-term market depth.
Stick to options where the bid-ask spread is no more than 10% of the mid-price. This guideline helps you minimize transaction costs that could eat into your profits. High-volume underlyings like SPY, QQQ, and AAPL often have spreads as tight as $0.01, making them ideal for trading. Focus on at-the-money strikes with expirations of 30–60 days to find the best balance of liquidity and trading interest.
To improve execution, use limit orders set at the midpoint between the bid and ask, rather than market orders, to avoid unfavorable fills in less liquid markets. Additionally, check the size column to ensure there are enough contracts available to fill your order without causing slippage.
For covered-call strategies, tools like ThetaEdge simplify the process by combining volume, open interest, and spread analysis into one user-friendly platform. The Thetix AI assistant tailors liquidity evaluations to your portfolio and provides daily action plans, helping you identify trades that not only align with your strategy but also execute at competitive prices.
FAQs
What liquidity numbers are “good enough” for my trade size?
When it comes to liquidity, "good enough" typically means a mix of high trading volume, significant open interest, and tight bid-ask spreads. These elements work together to make trades smoother and more cost-effective.
For most traders, options with thousands in both volume and open interest, along with narrow spreads compared to the option price, are generally seen as liquid. However, if you're dealing with larger trades, you might need even higher numbers to minimize slippage and keep costs under control.
How do I judge if a spread is too wide for a cheap option?
When analyzing an option, take a close look at the bid-ask spread in relation to its price. If the spread accounts for a large percentage of the option's price - say, over 10-15% - it often signals low liquidity and higher trading costs. This is especially important for inexpensive options, where even small differences in the spread can significantly impact your overall cost.
For efficient trading, prioritize options with tight spreads. These allow you to minimize costs and make it easier to enter or exit positions when needed. On the other hand, wider spreads can complicate trading, as they may lead to higher slippage and make it tougher to execute trades at favorable prices.
Why can volume look high but fills still be bad?
High trading volume doesn't necessarily guarantee favorable fills. Volume measures daily trading activity, but it doesn't reveal the market depth - the actual supply and demand at various price levels. Issues like low open interest or a wide bid-ask spread can result in slippage or partial fills. Even when volume is high, a lack of liquidity at crucial price points can make executing large trades smoothly a challenge.